Tabulate API Responses with Postman Visualizer
Back in 2014, a new issue regarding tabular views was opened on postman’s github page. The issue was closed in September 2019 with a note that Postman started supporting such tabular views. This new feature was released with version 7.7 (only version 7.7.2 could be found in release notes). Let’s have a look what this means and how to work with it in Postman.
Where to find it in Postman
The whole new feature relates to responses, so you can find it on the response panel all the way on the right side:

That means that besides options pretty, ran, preview, there’s a new way to show reponses.
New feature
As it might already be clear, the new feature can display/show responses in a tabular view. Let’s have a look at an example. I might get a json response similar to this:
{
    "Cards": [
        {
            "Ean": "11101781534",
            "User": {
                "Phone": "739844920",
                "Email": "pavel.saman@inveo.cz",
                "FirstName": "Pavel",
                "LastName": "Šaman"
            }
        },
        {
            "Ean": "11101781547",
            "User": {
                "Phone": "739844920",
                "Email": "samanpavel@gmail.com",
                "FirstName": "Pavel",
                "LastName": "Šaman"
            }
        },
        {
            "Ean": "11101781586",
            "User": {
                "Phone": "789456123",
                "Email": "samanpavel+04@gmail.com",
                "FirstName": "Pavel",
                "LastName": "Saman"
            }
        }
    ],
    "CardTotalCount": 3
}
I’m already showing it in a pretty format, so it’s easy to read.
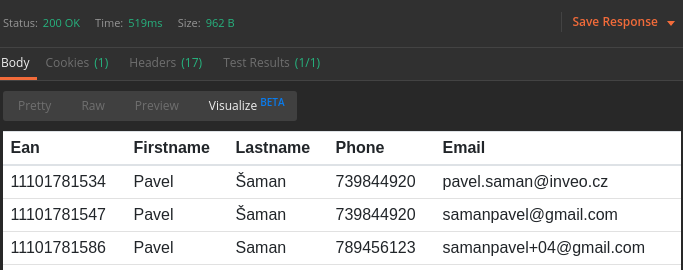
Now, within Postman’s visualizer, you can also show the same data in a table:

Actually, you can use more data visual representations, not only tables. Postman has other examples on their official site.
How to use it?
When it’s clear what’s possible to do with it, I’ll show a short example of how to represent data as a table as I did in the previous picture.
First, you’d need to go to the Tests tab and make sure you parse your response data as json:
// parse json response
const response_data = pm.response.json();
Another step would be to use a string literal:
let template = ``;
The last step would be to actually visualize the data using set method:
// visualize
pm.visualizer.set(template, {response: response_data.Cards });
However, this is just a template, now you’d need to go back and play around with the template string. In it, you can use handlebars, html, css, so you make the final outcome (table in my case) the way you want it.
Since I don’t particularly enjoy creating my own html and/or css, I will use BootstrapCDN with one of their tables. It’s easy enough, so I just tweak the table, no need to create it from scratch.
After doing this, my template variable looks like this:
let template = `
<link rel="stylesheet" href="https://stackpath.bootstrapcdn.com/bootstrap/4.3.1/css/bootstrap.min.css" integrity="sha384-ggOyR0iXCbMQv3Xipma34MD+dH/1fQ784/j6cY/iJTQUOhcWr7x9JvoRxT2MZw1T" crossorigin="anonymous">
<script src="https://stackpath.bootstrapcdn.com/bootstrap/4.3.1/js/bootstrap.min.js" integrity="sha384-JjSmVgyd0p3pXB1rRibZUAYoIIy6OrQ6VrjIEaFf/nJGzIxFDsf4x0xIM+B07jRM" crossorigin="anonymous"></script>

<table class="table table-hover">
  <thead>
    <tr>
      <th scope="col">Ean</th>
      <th scope="col">Firstname</th>
      <th scope="col">Lastname</th>
      <th scope="col">Phone</th>
      <th scope="col">Email</th>
    </tr>
  </thead>
  <tbody>

    <tr>
      <td></td>
      <td></td>
      <td></td>
      <td></td>
      <td></td>
    </tr>

  </tbody>
</table>
`;
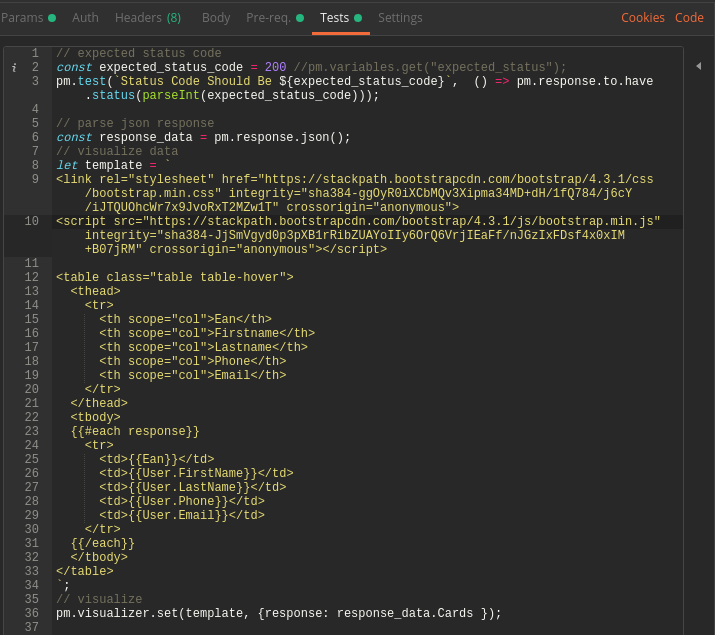
And the whole Tests tab like this (you can ignore the first few rows with the test for the status code):

And that really is all :)
Conclusion
Personally, this is a feature I can live without. It might be nice to have it for some edge use cases, but in my example, pretty json is already pretty enough, so I can read it like that with no need to make a table out of the data. On the other hand, if you need to share the results with somebody, it might come in handy to be able to transform it into such a tabular format.