Finding Information in Application Logs With KQL
I’ve written a brief article about different sources of information in testing. I’ll bit more concrete today and play around with KQL and Azure monitoring and logs.
Azure offers many different services and tools one can use during the software development lifecycle. One such service is Application Insights that allows you, apart from other things, to view application logs. That in itself is a great resource of information for testing.
Azure uses Kusto Query Language (KQL) as a query language, which should not be that unfamiliar if you already know other query languages like SQL. But it has its own ways of doing things. If you want to check a more complete tutorial, I recommend this official one form Microsoft.
First things first, Azure and KQL works with the idea of tables, so let’s have a look at requests table first:
requests
this might take a long time and might even be discouraged if a table is too big, so perhaps you want to first know how many records a table holds:
requests | count
Yes, that’s right, KQL works with pipes. If you are familiar with Linux command-line environment, this is fairly similar. Whatever data one command produces on the output ends up on the input of the next command.
Let’s say I have http methods and endopoints in a table field/column called operation_Name, and I want to filter by that:
requests
| where operation_Name contains "/Login"
But then I’m interested in only last 24 hours:
requests
| where timestamp >= ago(1d)
| where operation_Name contains "/Login"
I can use where any number of times. I can also use where in any place in my query, a strict order is not required like in SQL, so I can first sort and then filter. In reality, it’s better to filter before sorting because of performance reasons, you always want to work with as few records as possible.
The requests table gives me a lot of columns, let’s focus on just those I want:
requests
| where timestamp >= ago(1d)
| where operation_Name contains "/Login"
| project timestamp, name, url, resultCode, success
I can also use project-away operator that filters out those columns I don’t want.
Now I want to summarize these records by the resultCode column:
requests
| where timestamp >= ago(1d)
| where operation_Name contains "/Login"
| project timestamp, name, url, resultCode, success
| summarize count = count() by resultCode
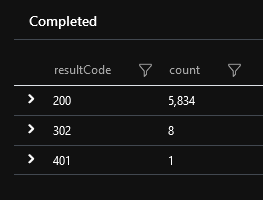
In my case, this returned:

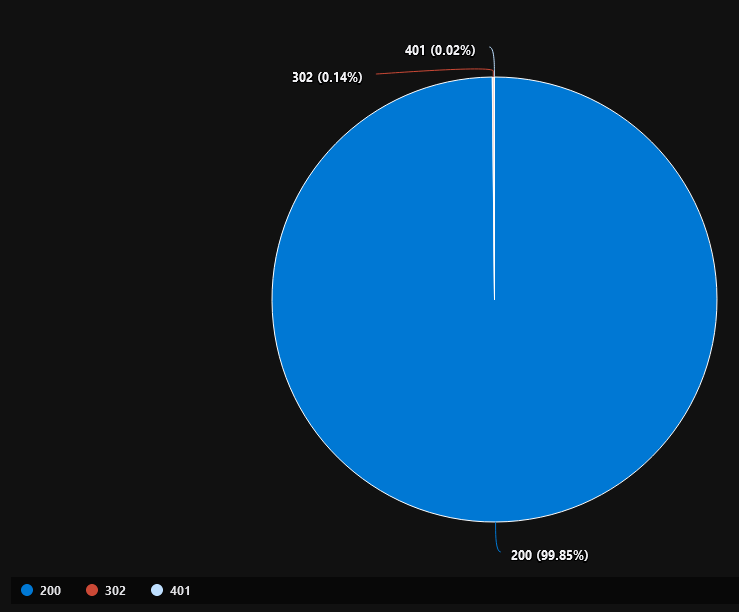
I don’t need to show the data only in a tabular format, I can use various graphs:

All I had to do to render this piechart was add another command to my query:
requests
| where timestamp >= ago(1d)
| where operation_Name contains "/Login"
| project timestamp, name, url, resultCode, success
| summarize count = count() by resultCode
| render piechart
You can see that working with KQL is really easy and there’s quite a lot you can do with it in a matter of minutes.
Another slightly more comples example could be:
traces
| where timestamp >= ago(1d)
| where appName == "abc"
| extend d=parse_json(customDimensions)
| project timestamp, d.ActionName, message, customDimensions
| project-rename Timestamp = timestamp, Endpoint = d_ActionName, Message = message, OriginalData = customDimensions
| summarize Number_of_log_entries = count() by bin(Timestamp, 1h)
| order by Timestamp asc, Number_of_log_entries desc
| render timechart
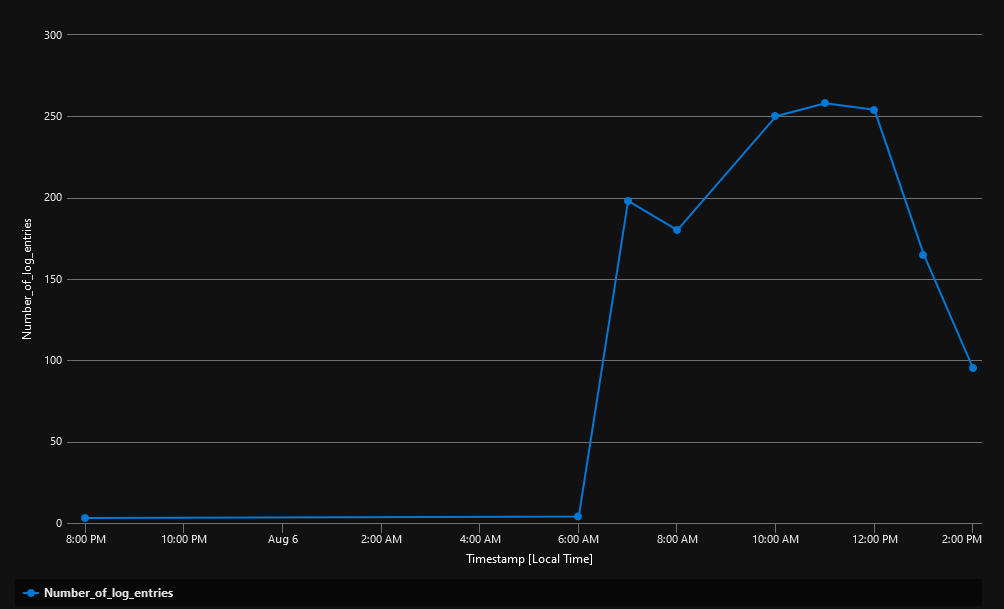
which translates to: “give me records from last 24 hours for just abc app, parse customDimentions as json and add it as a new column d, then give me only some columns and rename them, summarize the records by timestamp in a way that bins by 1 hour are created (this is the idea behind histograms), than order the result and create a timechart from it”.
And the result looks like this:

which gives me an idea about when the app is most used because that’s exactly when it generates the most log entries.
There’re much more to it than these brief examples. Yet in order to find some errors, failed queries etc, this is a good start that can help Testers have a different insight into what the software does.
In conclusion, I’d recommend following these points when working with KQL:
- use
Shift+Enterto execute queries, keyboard is simply faster - use KQL’s intellisense, it works fine, you don’t need to remember every single function or operator
- limit number of rows first, this translates into using
whereas soon as possible, filtering by timestamp first is probably a good idea for the very same reason - project just those columns you need in the result set, that’s a way of limiting the amount of data as well, the less data you pass further the faster the queries will be
- you can save and pin most used queries to a dashboard, that way you can create your own testing dashboard where you see potential problems very quickly
Testing with looking into application logs is something that can help you find more problems. In Azure, this is a way how to find fast what you’re looking for, all you need is a bit of learning about KQL language.